Ratio Analysis: A Complete Guide for Investors
Ratio Analysis is the cornerstone of financial statement interpretation. Whether you're a retail investor, financial analyst, or business owner, understanding ratios allows you to break down complex financial reports into meaningful insights. From measuring liquidity to evaluating profitability and risk, ratio analysis is your toolkit for smarter decisions.
What is Ratio Analysis?
Ratio Analysis involves evaluating the relationship between two or more items from a company’s financial statements. These ratios help you assess various aspects of a company’s performance — such as its liquidity, solvency, efficiency, and profitability — in a standardized, comparable format.
Most ratios are derived from the income statement, balance sheet, or cash flow statement. When tracked over time or compared with peers, they reveal powerful trends and red flags.
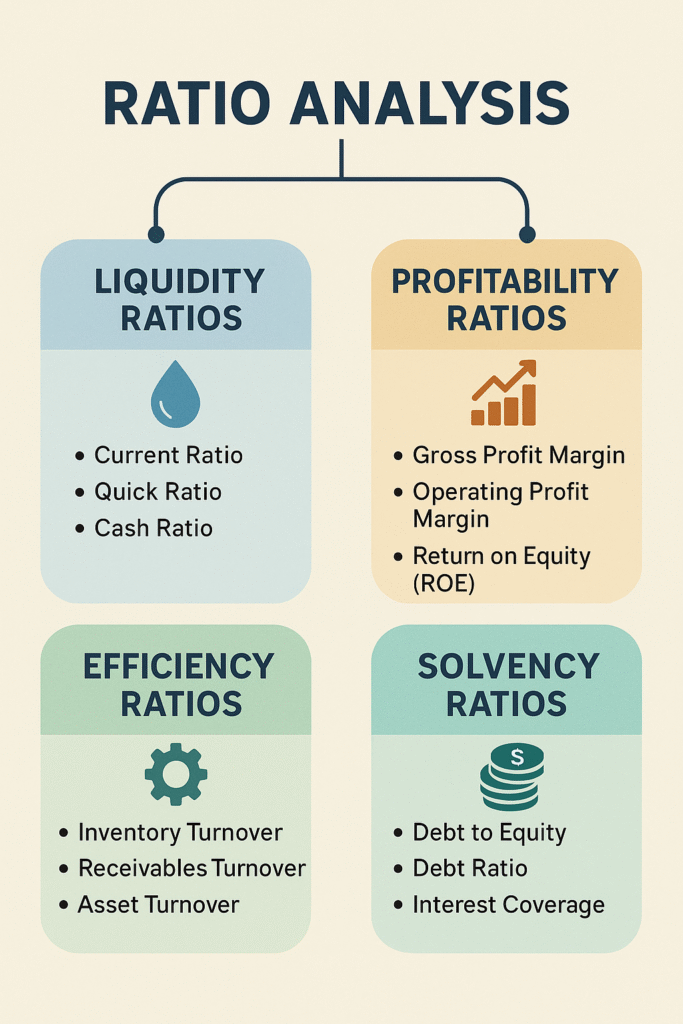
Types of Ratios
Ratios are broadly classified into the following categories:
- Liquidity Ratios – Measure short-term solvency
- Profitability Ratios – Assess earnings performance
- Solvency Ratios – Analyze long-term debt sustainability
- Efficiency Ratios – Gauge how well assets are utilized
- Market Valuation Ratios – Used in investment decisions
1. Liquidity Ratios
Liquidity ratios reveal whether a company can meet short-term obligations using its current assets.
Current Ratio
Formula: Current Assets / Current Liabilities
Indicates the ability to pay off short-term liabilities with short-term assets. A ratio between 1.5 and 2 is generally healthy.
Quick Ratio (Acid-Test)
Formula: (Current Assets - Inventory) / Current Liabilities
A more conservative version, excluding inventory since it’s less liquid. Ideal value: >1.
2. Profitability Ratios
These measure the ability of a company to generate profits relative to sales, assets, or equity.
Gross Profit Margin
Formula: (Revenue - Cost of Goods Sold) / Revenue
Shows how efficiently a company produces goods. Higher is better.
Net Profit Margin
Formula: Net Profit / Revenue
Indicates what percentage of revenue becomes profit after all expenses.
Return on Equity (ROE)
Formula: Net Income / Shareholder’s Equity
Reflects the return generated on investor capital. Strong companies usually have ROE above 15%.
Return on Assets (ROA)
Formula: Net Income / Total Assets
Shows how effectively assets are being used to generate profit.
3. Solvency Ratios
These reflect a company’s long-term financial stability and debt-handling capacity.
Debt-to-Equity Ratio
Formula: Total Debt / Shareholder’s Equity
Shows how leveraged a company is. A D/E of less than 1 is generally preferred.
Interest Coverage Ratio
Formula: EBIT / Interest Expense
Indicates how easily a company can cover its interest payments. A ratio >3 is considered safe.
4. Efficiency Ratios
Efficiency ratios show how well a company is managing its resources.
Inventory Turnover
Formula: Cost of Goods Sold / Average Inventory
High turnover means inventory is sold quickly — good for cash flow.
Receivables Turnover
Formula: Net Credit Sales / Average Accounts Receivable
Higher turnover means quicker cash collection from customers.
Asset Turnover
Formula: Net Sales / Average Total Assets
Reveals how efficiently assets are used to generate revenue.
5. Market Valuation Ratios
These help investors assess whether a stock is overvalued or undervalued.
Price to Earnings (P/E) Ratio
Formula: Market Price per Share / Earnings per Share
A lower P/E may indicate undervaluation, but industry comparison is key.
Price to Book (P/B) Ratio
Formula: Market Price per Share / Book Value per Share
Values companies based on their net asset value.
Dividend Yield
Formula: Dividend per Share / Market Price per Share
Indicates return from dividends relative to price. Useful for income investors.
Example: Ratio Analysis of XYZ Ltd.
Assume the following for FY 2024:
- Revenue: ₹10,000 crore
- Net Profit: ₹1,200 crore
- Total Assets: ₹8,000 crore
- Equity: ₹4,000 crore
- Total Debt: ₹2,000 crore
Then:
- Net Profit Margin: 1,200 / 10,000 = 12%
- ROE: 1,200 / 4,000 = 30%
- ROA: 1,200 / 8,000 = 15%
- D/E Ratio: 2,000 / 4,000 = 0.5
This tells us XYZ Ltd. is highly profitable, efficient, and financially stable.
How to Use Ratio Analysis Effectively
- Compare with past years (trend analysis)
- Compare with industry peers (benchmarking)
- Combine multiple ratios for a 360° view
- Don’t rely on one ratio in isolation
- Always read alongside qualitative factors (management, sector, regulation)
Limitations of Ratio Analysis
- Based on historical data — not future-proof
- Different accounting policies may distort comparability
- Seasonal businesses may show misleading ratios
- Doesn’t capture management quality, brand value, or macro risk
Final Thoughts
Ratio analysis is not just a numbers game — it’s a window into how a company operates, competes, and grows. As an investor, mastering financial ratios helps you ask the right questions and avoid red flags before it’s too late.
Want to go deeper? Explore our guides on Fund Flow Statement, Working Capital Assessment, and Cash Flow vs Profit.
📩